From Regression to ANOVA
We use linear regression to understand relationships between continuous variables. We extend the theory of regression to Analysis of Variance (ANOVA) when we want to understand relationships between categorical variables.
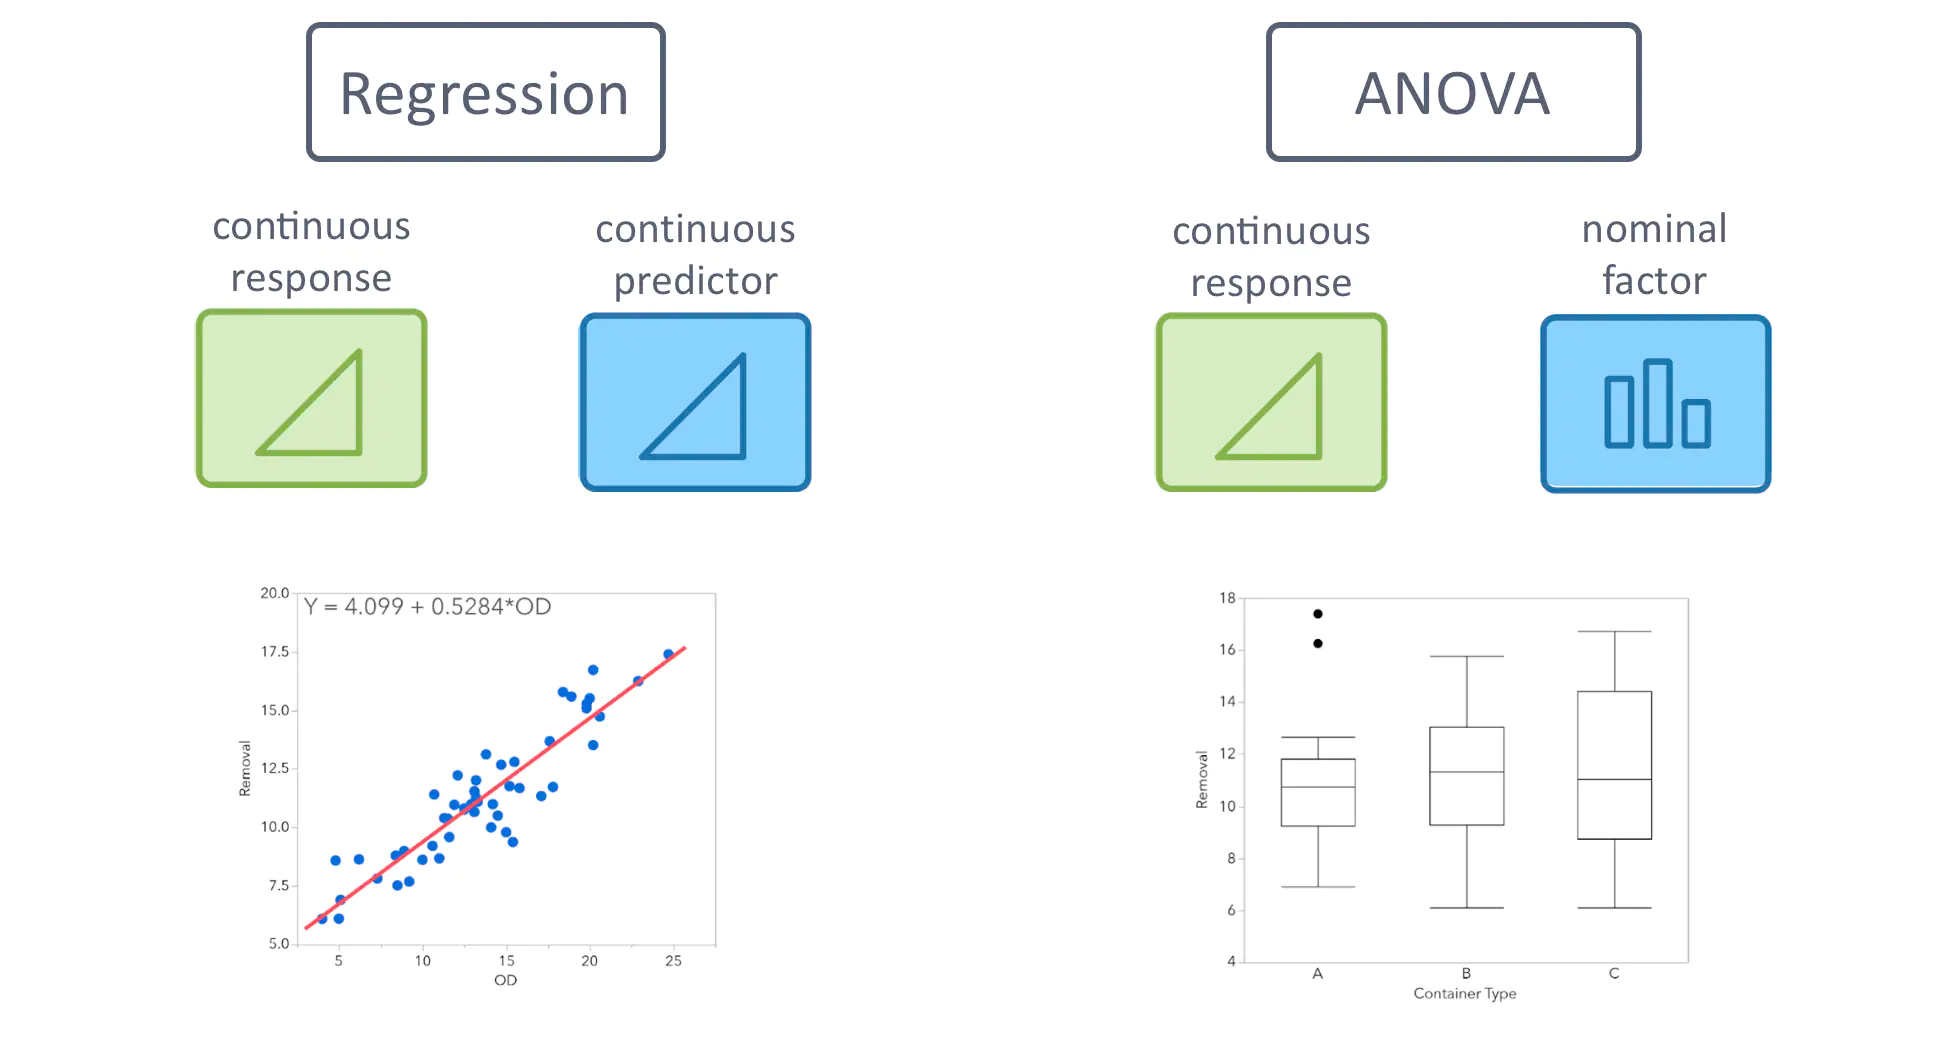
The Bridge from Regression to ANOVA
Linear regression helps us understand how one continuous variable influences another. For example, we might examine how water temperature affects fish growth rates. ANOVA, on the other hand, enables us to compare outcomes across different categories.
Let’s consider this scenario: How do different marine habitats impact fish species diversity? This is where ANOVA comes in.
Core Mathematical Differences
While both techniques share statistical foundations, they have distinct focuses:
Linear Regression estimates an average response and its variability (\(\sigma^2\)) based on continuous predictors. It’s like drawing a line through a scatter plot of data points.
ANOVA highlights differences between the means of different categorical groups. It’s more like comparing the heights of several bar graphs.
The Math Behind ANOVA: A Special Form of Regression
At its core, ANOVA is closely related to linear regression. While regression deals with continuous predictors, ANOVA handles categorical ones. To bridge this gap, we use a special technique to represent categories numerically.
Let’s consider an example. Imagine we’re studying how different marine habitats (seagrass, sand, and coral reef) affect fish species diversity. In a regression-like format, we could represent this as:
\[ \text{Fish Species Diversity} = \text{Baseline Diversity} + (\text{Effect}_\text{seagrass} \times \text{Is it Seagrass?}) + (\text{Effect}_\text{sand} \times \text{Is it Sand?}) \]
Here, “Is it Seagrass?” and “Is it Sand?” are indicator variables that take values of either 0 (no) or 1 (yes). We don’t need an “Is it Coral Reef?” variable because when both “Is it Seagrass?” and “Is it Sand?” are 0, it implies that the habitat type is Coral Reef. This habitat serves as our reference category.
This equation sets up the average fish species diversity for each habitat type in relation to the reference category (Coral Reef). ANOVA then tests if the average diversities for these habitat types are statistically different from each other.
As we learn more about ANOVA, remember that it’s essentially a specialized form of regression tailored for categorical variables.