Interpreting the Output of T-Tests in R
Once you run a t-test in R, you’ll get a list of results. Here’s how to interpret them:
1. t-value
This is the test statistic. It quantifies the difference between the groups relative to the variation within the groups. The formula for the t-value varies depending on the type of t-test, but in essence, it’s a ratio of the difference between groups to the variability within groups.
- Rule of Thumb: The larger the absolute value of the t-statistic, the more likely the result is significant.
2. Degrees of Freedom
Often abbreviated as “df”, this value represents the number of independent values that can vary without violating any statistical constraints. the degrees of freedom determine the shape of the t-distribution used to calculate the p-value.
3. p-value
This is a fundamental component of hypothesis testing. The p-value gives the probability of observing a t-statistic as extreme as, or more extreme than, the one computed from the sample, assuming the null hypothesis is true. A small p-value (typically ≤ 0.05) indicates strong evidence against the null hypothesis, so you reject it. A larger p-value suggests weak evidence against the null hypothesis, so you retain it.
4. Confidence Interval
This interval estimate provides a range within which the true population parameter (like the difference between means) is likely to lie, with a certain level of confidence. A 95% confidence interval, for instance, means that if you were to take many samples and compute an interval estimate from each of them, about 95% of the intervals would contain the true population parameter.
5. Sample Means
The output also typically displays the means of the samples or groups you’re comparing. This helps in understanding the direction and magnitude of the difference.
6. Alternative Hypothesis
R will also display the specific form of the alternative hypothesis you’re testing. It could be:
“true difference in means is not equal to 0” (two-tailed)
“true difference in means is greater than 0” (one-tailed, greater than)
“true difference in means is less than 0” (one-tailed, less than)
7. Additional Information
Depending on the specific test and options you’ve used, the output might also include:
Sample Variances: Particularly if you’re considering whether variances are equal or not.
Confidence Level: Usually set at 95% by default, but this can be changed.
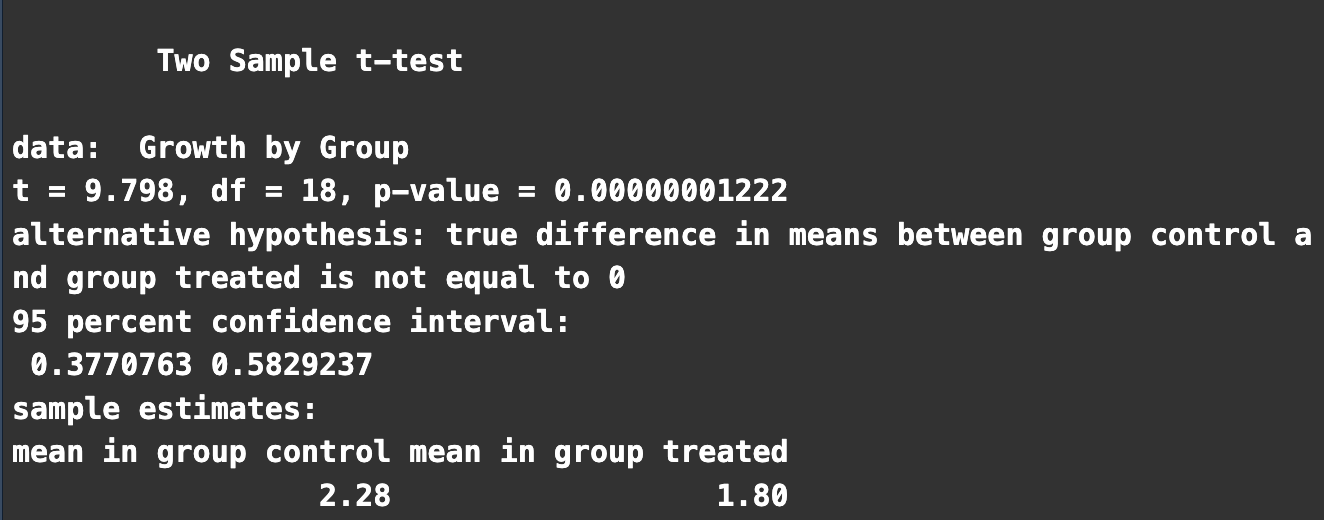
Sample Output Interpretation:
For instance, if you get a t-value of 2.5, degrees of freedom as 48, and a p-value of 0.017 from a two-sample t-test, you can interpret it as:
The observed difference between the sample means is 2.5 times larger than what you would expect from random sampling variation.
Given 48 degrees of freedom, this t-value yields a p-value of 0.017.
Since 0.017 < 0.05 (assuming a 5% significance level), there’s strong evidence to reject the null hypothesis that the population means are equal.
It’s good practice to not only rely on the p-value but to consider the entire output, including the confidence intervals and effect size, to make informed decisions based on the t-test results.