Assignment 1: due Sept 4
This is worth 8 points. Follow these instructions carefully, answer all questions where indicated, and submit as instructed below.
1. Data Preparation
- Open the Excel spreadsheet you made after last week’s Activity #2
- Ensure you’re using the version that includes the
speciescolumn created withVLOOKUP. - Save this file as
Yourfirstinitiallastname_MES503_LabAssignment1.xlsx.
2. Adding an Index Column
- In the DATA worksheet, insert a new column as the first column.
- Label this column “index”.
- Populate it with sequential numbers starting from 1 (1, 2, 3, … to the last row of data).
- This index serves as a unique identifier for each coral colony surveyed.
3. Creating Pivot Table
- Create a new pivot table based on your entire dataset. Place this pivot table in a new worksheet.
4. Calculate Mean Length
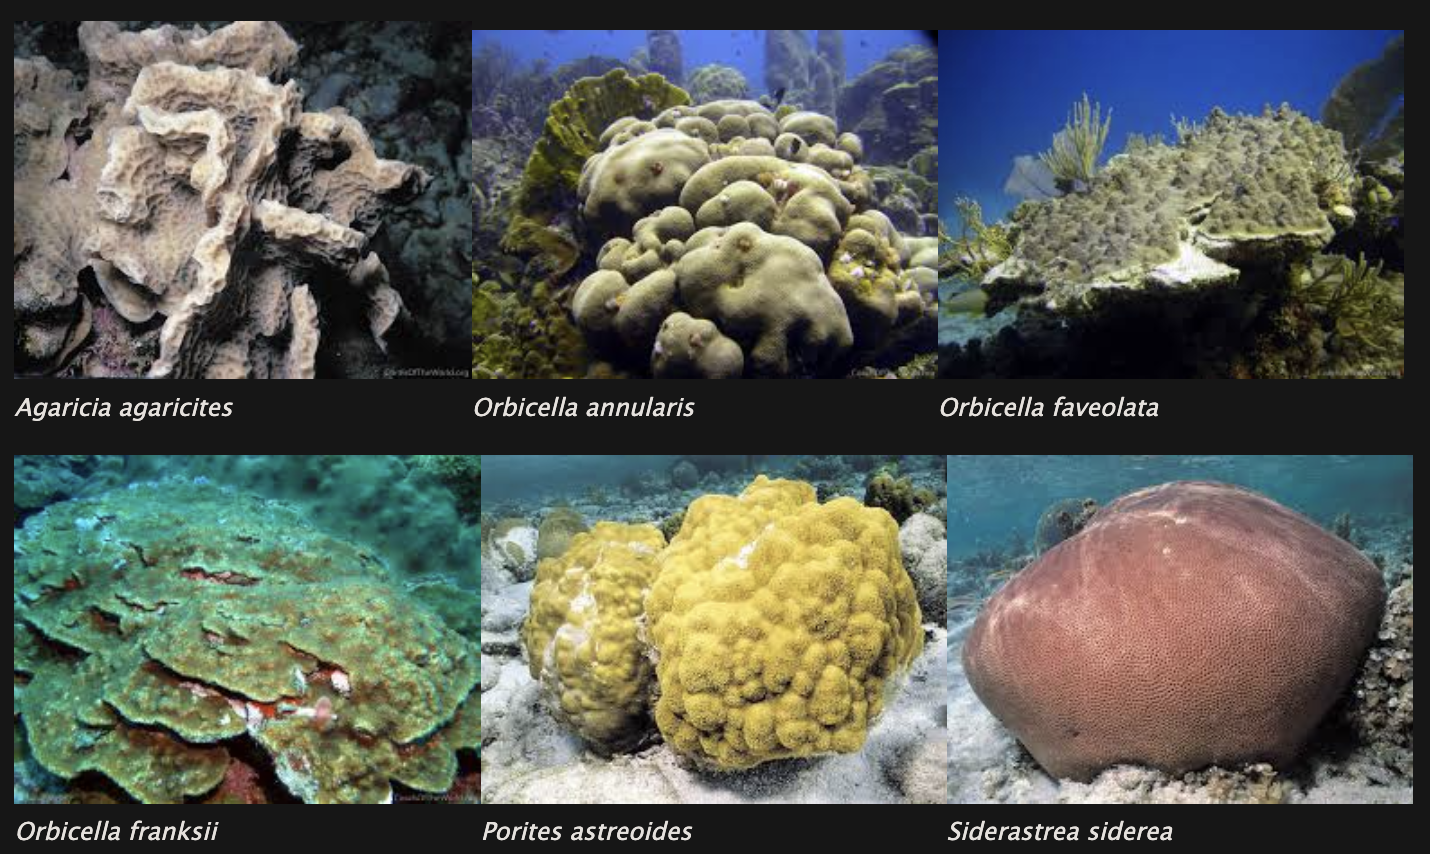
Using the pivot table, Compute the mean length for these species: Agaricia agaricites, Orbicella annularis, Orbicella faveolata, Orbicella franksii, Porites astreoides, and Siderastrea siderea.
5. Calculate Standard Deviation, n, and SEM
For each species listed in step 4:
Use the pivot table to calculate the standard deviation (
StDev) and sample size (n) for length.Compute the standard error of the mean (SEM) for length.
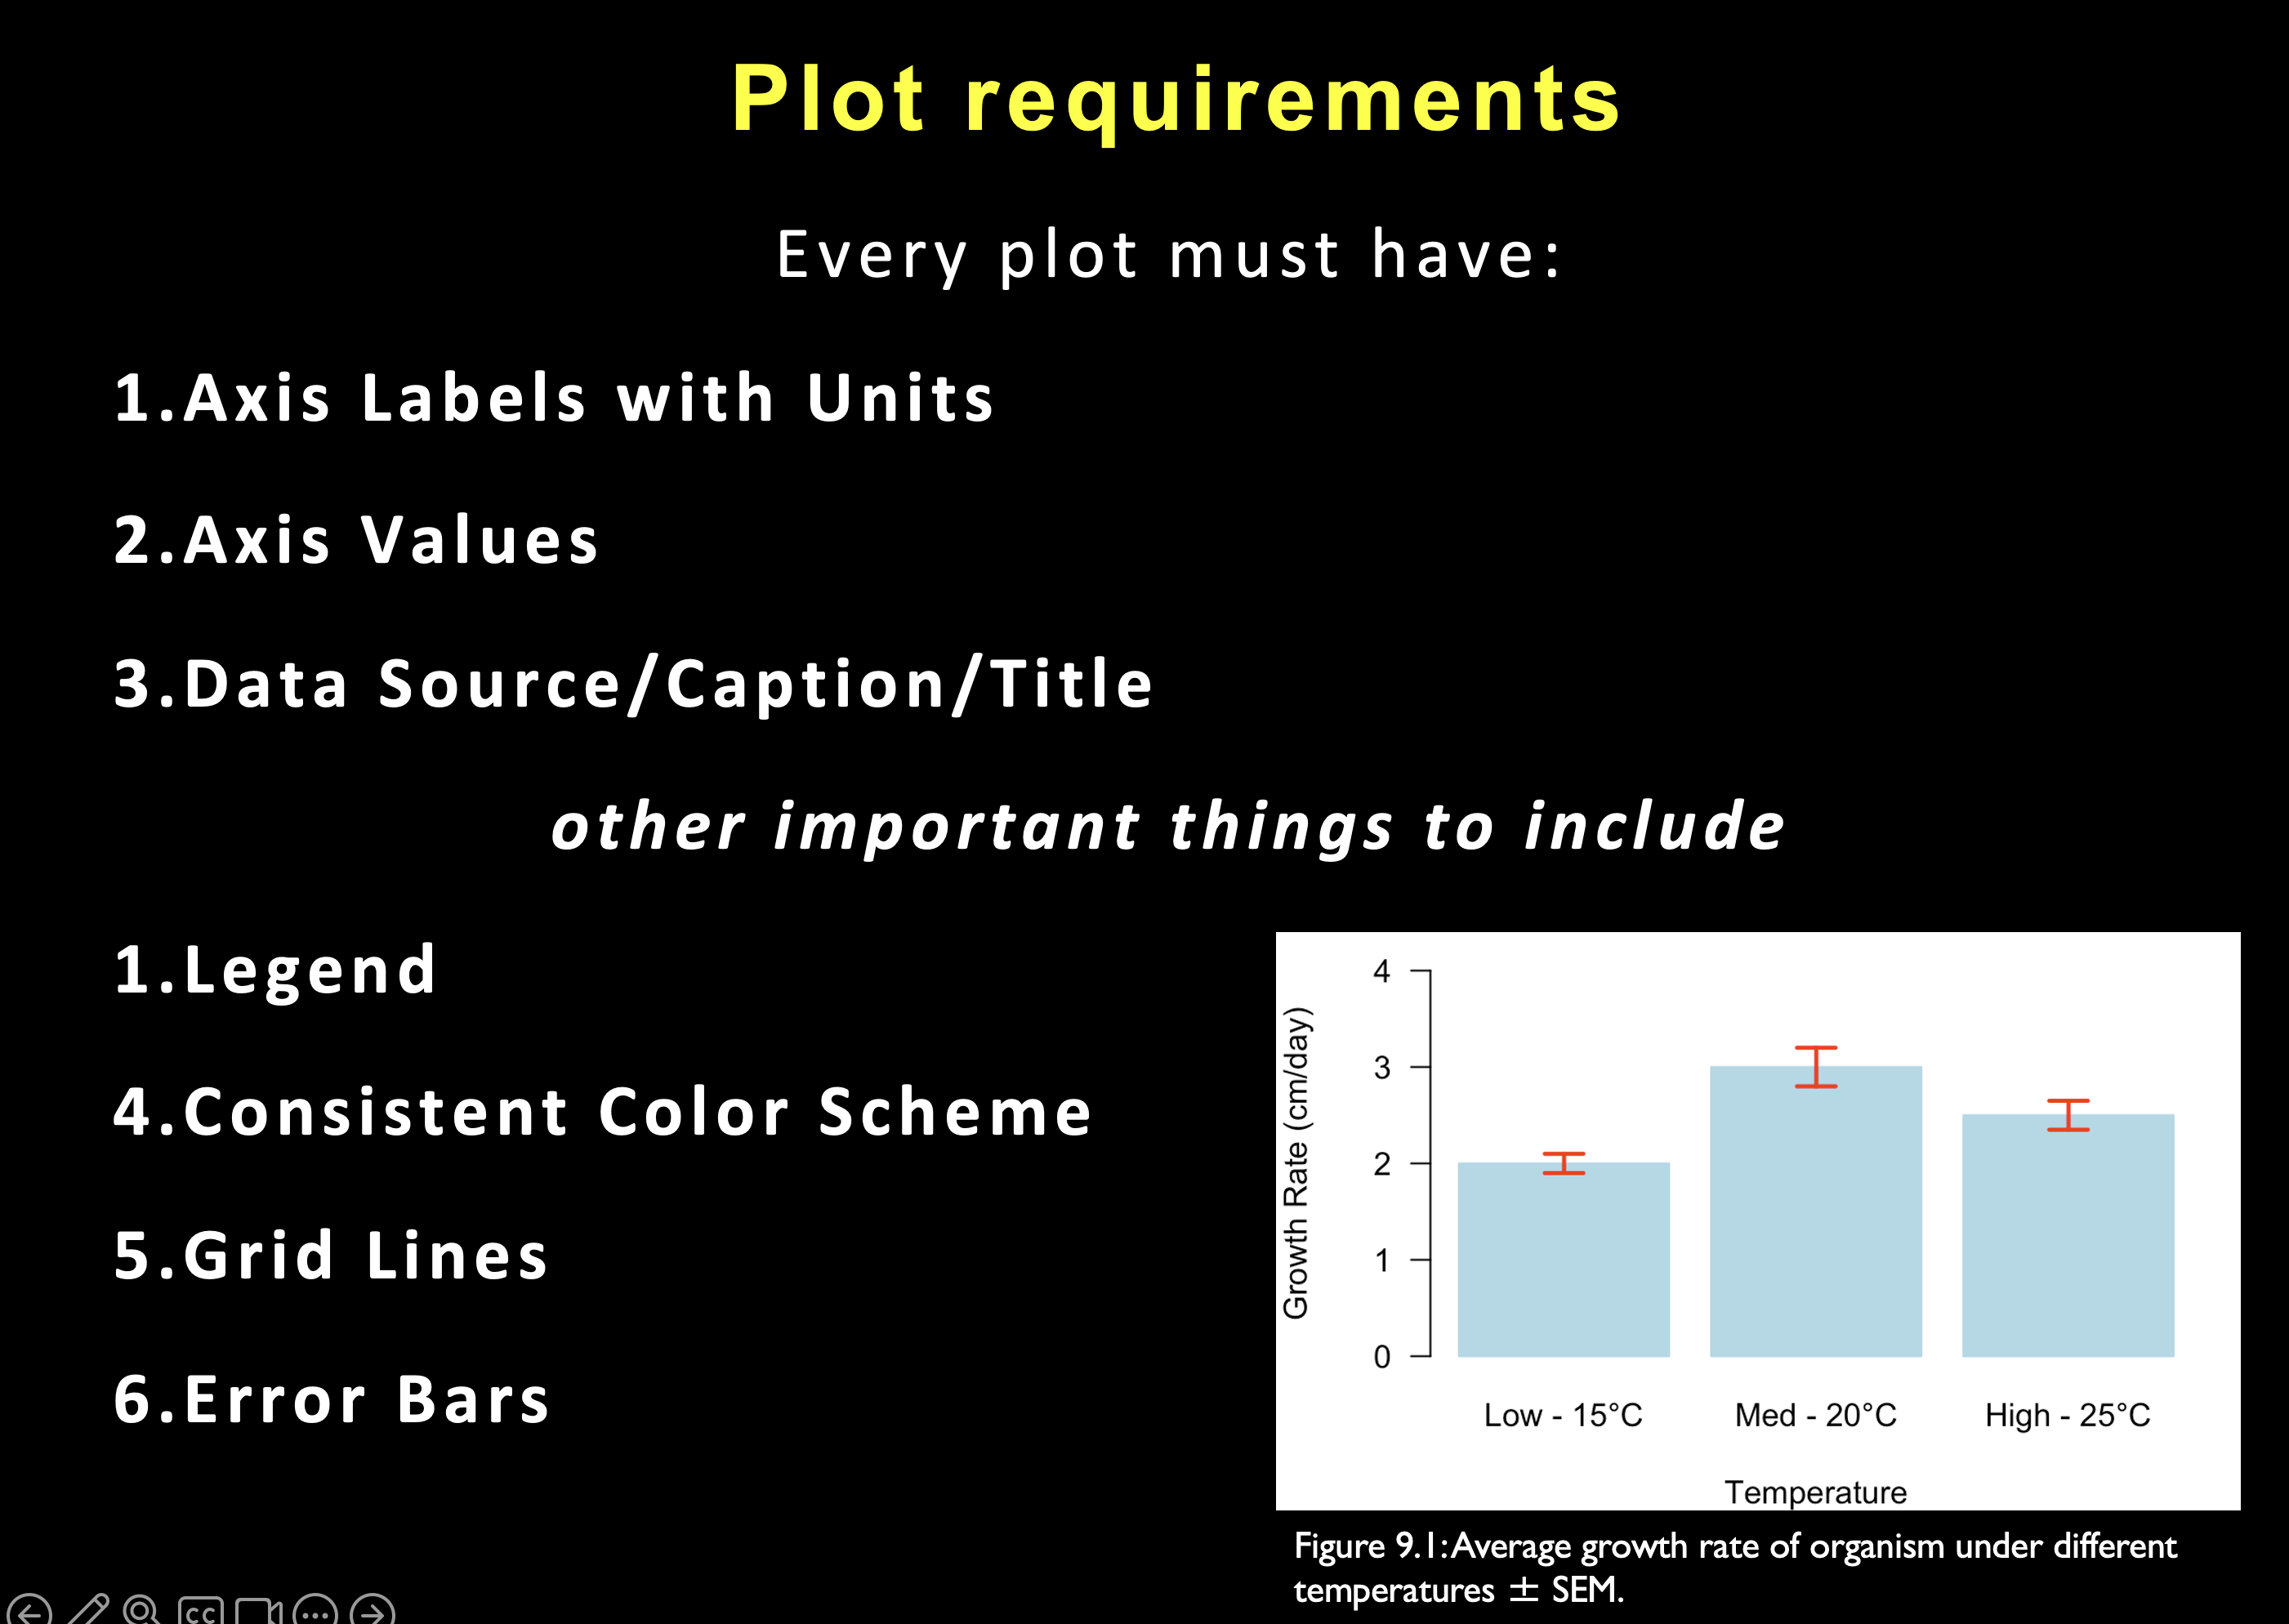
6. Data Visualization
- Create a graph displaying the mean length ± SEM for the 6 species.
- Ensure your graph includes:
- Properly labeled x and y axes
- Appropriate axis values
- Clear and detailed title or caption (this will be replaced as caption in your eventual reports/writings)
- Correct units
7. Data Interpretation
Answer these questions in a clearly labeled part of your Excel spreadsheet:
Which type of plot did you choose and why? Explain why a histogram would not be appropriate for this data.
Based on your pivot table and plot, select any two species. Using the error bars you plotted, predict whether a statistical test would likely show a significant difference in the means of these two species. Provide a clear explanation for your prediction.
8. Montastrea cavernosa Analysis
- Create a new pivot table from your original data.
- Use this pivot table to calculate the percentage of colonies in each transect that are Montastraea cavernosa.

9. Final Steps and Submission
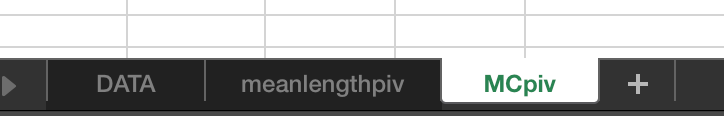
Name the worksheet containing the mean length pivot table, data, and graph (steps 3-7) as “meanlengthpiv”.
Name the worksheet with the Montastrea cavernosa pivot table (step 8) as “MCpiv”.
Ensure all worksheets are clearly labeled and organized.
Email your completed file (
Yourfirstinitiallastname_MES503_LabAssignment1.xlsx) to lauren.olinger@uvi.edu with the subject line “Lab Assignment 1” by or before the posted due date and time.
Prepare for Next Week: Install R and RStudio
Starting next week, we will be using R and RStudio for the remainder of the semester. To prepare:
- Download and install R from The Comprehensive R Archive Network (CRAN).
- Download and install RStudio Desktop from the RStudio website.
- Verify that you can successfully open RStudio on your computer.
If you encounter any issues with installation, please seek assistance before the next lab.