= A1 + B1Core Concepts in Excel
Demo
download the demo xlsx here -> demo.xlsx
“Data is the new oil. It’s valuable, but if unrefined it cannot really be used.” - Clive Humby
Excel in Research
in research we work with various types of data:
- Species counts
- Environmental measurements (temperature, salinity, pH)
- Geospatial data
- Temporal data (time series)
- Many more…
Excel provides a user-friendly platform to:
- Input and organize raw data
- Clean and preprocess datasets
- Perform basic statistical analyses
- Create visualizations (charts and graphs)
- Collaborate with colleagues
Anatomy of a Spreadsheet
- Workbook: An Excel file (with a .xlsx extension) that contains your datasets. Think of it as a book that holds all your research data.
- Worksheet: Individual ‘tabs’ within a workbook. Dedicate each worksheet to specific parts of your research or different datasets.
-
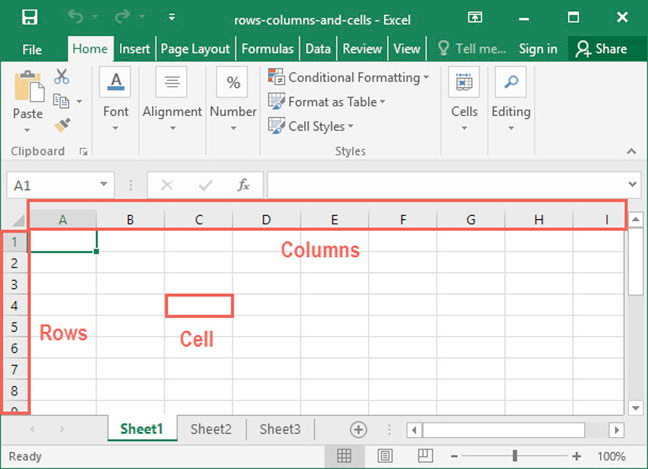
Cells, Rows, and Columns: The building blocks of Excel’s grid structure.
- Cells: Individual data points where rows and columns intersect.
- Rows: Horizontal arrangements of cells (numbered).
- Columns: Vertical arrangements of cells (lettered).
-
Functions and Formulae:
- Functions: Pre-built operations in Excel (e.g., SUM, AVERAGE, COUNT).
- Formulae: Custom expressions you create using functions, cell references, and operators.

Important Considerations
-
File Formats:
- .xlsx is Excel’s native format but is not open-source.
- Comma-Separated Values (CSV) files are plain text, making them more accessible across different platforms and software. However, they lack formatting and multiple-sheet capabilities of .xlsx files.
- Consider saving final datasets as .csv for improved transparency and compatibility
-
Excel vs Google sheets:
- While Google Sheets offers collaborative features, Excel is preferred for research due to superior handling of large datasets - More robust statistical and analytical functions, Better integration with other scientific software, Enhanced data protection and privacy controls
-
Advanced Tools for Data Analysis:
- While Excel is valuable for initial data management, limitations emerge with complex analyses or large datasets. These are better handled by specialized software like R, Python, or MATLAB.
Commonly Used Excel Functions
-
Basic Arithmetic Operations
- Addition:
-
Subtraction:
= A1 - B1- Multiplication:
= A1 * B1- Division:
= A1 / B1 -
SUMAdds a range of cells.= SUM(A1:A10) -
AVERAGECalculates the average of a range of cells.=AVERAGE(A1:A10) -
COUNTCounts the number of cells that contain numbers.=COUNT(A1:A10) -
COUNTACounts the number of cells that are not empty.=COUNTA(A1:A10) -
IFReturns one value if a condition is true and another if it is false.=IF(A1 > 10, "Yes", "No") -
VLOOKUPSearches for a value in the first column of a range and returns a value in the same row from another column.=VLOOKUP(A1, B1:D10, 3, FALSE) -
HLOOKUPSearches for a value in the first row of a range and returns a value in the same column from another row.=HLOOKUP(A1, B1:F3, 2, FALSE) -
CONCATENATE(or CONCAT) Joins two or more text strings into one.=CONCATENATE(A1, " ", B1) -
TODAYReturns the current date.=TODAY() -
SUMIFAdds the cells specified by a given condition or criteria.=SUMIF(A1:A10, ">10") -
COUNTIFCounts the number of cells that meet a criterion.=COUNTIF(A1:A10, ">=10") -
TRIM Removes extra spaces from text.
=TRIM(A1) -
ROUND Rounds a number to a specified number of digits.
=ROUND(A1, 2)

