Parameters vs. Statistics

Imagine you’re studying the health of fish in the Great Barrier Reef. It would be ideal to examine every single fish, but that’s simply not feasible. Instead, you’d study a smaller group of fish and use that information to draw conclusions about the entire population. This scenario illustrates the key difference between populations and samples.
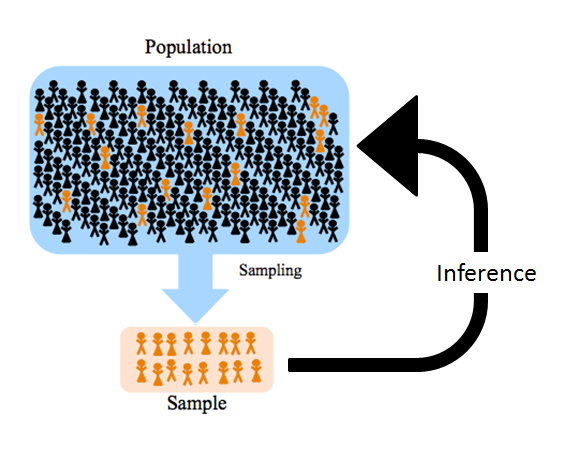
The branch of statistics called inferential statistics is often defined as the science of drawing conclusions about a population from observations made on a representative sample of that population. It is therefore crucial to properly distinguish between the two concepts. So, what exactly is the difference between population and sample? (Source)
Populations
A population includes every single member of the group you’re interested in studying. In our example, the population would be all the fish in the Great Barrier Reef. In other contexts, it might be:
- All voters in a country for a political scientist
- Every star in a galaxy for an astronomer
- All patients with a specific disease for a medical researcher
Samples
A sample is a subset of a population that we actually study. It’s our practical way to gain insights about the larger population. In our example, this might be the fish caught and examined during a week-long expedition.
Sample statistics are the values we calculate from our sample data. They serve as our best estimates of the true population parameters.
Of course, the sample must be selected to be representative of the population under study. If participants are included in a study on a voluntary basis, there is a serious concern that the resulting sample may not be representative of the population. It may be the case that volunteers are different in terms of the parameter of interest, leading to a selection bias. Another selection bias can occur when, for instance, a researcher collects citizens’ wage, by the means of internet. It might be the case that people having access to internet have different wages than people who do not have access. The gold standard to select a sample representative of the population under study is by selecting a random sample. A random sample is a sample selected at random from the population so that each member of the population has an equal chance of being selected. A random sample is usually an unbiased sample, that is, a sample whose randomness is not in doubt.
read more here.
The Language of Statistics
Parameters vs. Statistics : To maintain clarity, statisticians use different terms and symbols for population parameters and sample statistics.

Population Parameters - the known values
Population parameters are typically denoted with Greek letters. Some common ones include:
- μ (mu) for the population mean
- σ (sigma) for the population standard deviation
- ρ (rho) for the population correlation coefficient
These parameters represent the true values in the entire population. They’re often unknown and are what we’re trying to estimate through our research.
Sample Statistics - the best estimate
Sample statistics, on the other hand, use Roman letters. For example:
- \(\bar{x}\) or \(\bar{y}\) for the sample mean
- s for the sample standard deviation
- r for the sample correlation coefficient
These statistics are calculated from our sample data and serve as estimates of the corresponding population parameters.
Degrees of Freedom
Degrees of freedom (df) refer to the number of independent values or quantities that can vary in a statistical calculation without violating any constraints. In simpler terms, it represents the number of values in a data set that are free to vary when calculating a statistic. For example, if you are calculating the mean of a sample, once you know the mean, the sum of the deviations of each data point from the mean must equal zero. This constraint reduces the number of independent values by one.
When calculating the variance or standard deviation of a sample, statisticians use \(n−1\) instead of \(n\) in the denominator. This adjustment is known as Bessel’s correction and is crucial for obtaining an unbiased estimate of the population variance.
This is because, when you calculate statistics for an entire population, you use all available data points, so you divide by \(n\). However, when you are working with a sample, you are estimating the population parameters based on a subset of the data. Using n in this context tends to underestimate the true variability of the population.
Dividing by \(n−1\) corrects this bias by slightly inflating the variance estimate, making it a better reflection of the population variance. This is because the sample mean is used as an estimate of the population mean, which introduces an additional source of error. By reducing the degrees of freedom by one, you account for this estimation error.
Why This Matters
The distinction between population parameters and sample statistics is relevant at all levels of statistical analyses:
Estimation: We use sample statistics to estimate population parameters. Example: Oceanographers measure the salinity of 200 water samples across the Atlantic Ocean to estimate the average salinity of the entire ocean basin.
Hypothesis Testing: When we conduct statistical tests, we’re often testing hypotheses about population parameters using sample statistics. Example: Marine biologists test whether the average size of bluefin tuna in the Mediterranean Sea has decreased over the past decade by comparing samples from different years.
Confidence Intervals: These provide a range of values that likely contain the true population parameter, based on our sample statistic. Example: After analyzing sediment cores, geologists report they are 95% confident that the true mean depth of the Pacific Ocean lies between 4,000 and 4,300 meters.
Sampling Error: The difference between a sample statistic and the true population parameter is called sampling error. Understanding this concept is crucial for interpreting research results. Example: The discrepancy between the estimated and actual number of humpback whales migrating along the California coast, based on survey counts, illustrates sampling error in marine mammal population studies.
Study Design: Recognizing the difference between populations and samples is essential for designing effective studies and interpreting their results accurately. Example: When studying microplastic pollution in the Arctic Ocean, researchers strategically select sampling locations at various depths and distances from shore to ensure their sample represents the diverse conditions across the entire Arctic marine ecosystem.
It gets complicated
Although these concepts are straightforward, it can be challenging to apply them in real-world research:
Defining the Population: Sometimes, clearly defining the population of interest can be tricky. Example: In studying “coastal ecosystems,” researchers must decide whether to include estuaries, how far inland to extend their definition, and whether to include artificial coastlines like seawalls.
Representative Sampling: Ensuring that our sample truly represents the population is crucial but often difficult. Biased sampling can lead to incorrect conclusions. Example: When studying deep-sea biodiversity, collecting samples from only easily accessible areas may miss species unique to remote or extreme environments, leading to an underestimation of overall biodiversity.
Changing Populations: In some fields, populations can change rapidly. Example: A study of coral reef fish populations conducted before a major bleaching event may not accurately represent the current population structure and diversity after the event.
Rare Populations: Some populations are hard to sample adequately due to their rarity or the sensitivity of the subject matter. Example: Studying endangered marine species like the vaquita porpoise (or sea turtles!) is challenging due to their extremely low numbers and the difficulty in locating them without causing disturbance.
Test Your Understanding
Quiz: Population Parameters vs Sample Statistics
1. What symbol is commonly used for the population mean?
a) x̄b) μ
c) σ
2. Which of the following is a sample statistic?
a) Population standard deviationb) Population correlation coefficient
c) Sample mean
3. What does 'df' stand for in statistics?
a) Data formatb) Degrees of freedom
c) Differential factor
4. In the formula for sample variance, why do we divide by (n-1) instead of n?
a) To make the calculation easierb) To account for the loss of one degree of freedom
c) Its just a convention with no real meaning
5. What is the primary goal of statistical inference?
a) To collect as much data as possibleb) To draw conclusions about populations based on sample data
c) To eliminate the need for sampling