# Sample R code
data <- c(1, 2, 3, 4, 5)
mean_value <- mean(data)
print(paste("The mean is:", mean_value))
[1] "The mean is: 3"
Congratulations! You’re about to embark on a journey to become computer programmers and statisticians. Why? Because no matter what brought you to marine sciences, you’ll be dealing with numbers – lots of them.
Take a deep breath. You’re going to do just fine.
By the end of this course, you’ll have the skills to: 1. Design research projects 2. Collect and analyze data 3. Use practical and marketable tools in data science
Plus, you’ll leave with excellent reference materials. Because let’s face it, memorization is pointless.

Unlike most coursework, grad school is all about self-learning, trial and error, and questioning everything.
So, if you ask me a question, my most likely response will be “look it up”

This isn’t me being difficult. In fact, I’ve created this searchable website to make information as clear and accessible as possible. But I won’t give you the answers outright – there are some things you need to discover on your own.
When I say “look it up,” here’s what I mean:
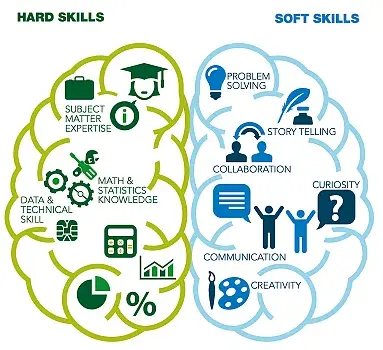
This lab manual! - If you are asking me something about a particular assignment, or steps to take, you might have missed something in the lab manual text, or in the assignment instructions. You number one first step should be to slow down, and fully read what I have given you that week. Being able to read an entire instruction or document before acting on it is another valuable soft skill.
Your peers - Science is inherently collaborative. You hit a snag and need to phone a friend? Ask a peer in the class. Maybe they picked up on something you didn’t.
Google: If you are still stuck or lookign for different ways to do something, go to google. I would make sure to first check out anything in stack overflow, reddit , and R forums (R-bloggers, R for data science, cross validated, etc).
Stack Overflow: For specific programming or statistics questions. Stack Overflow
R for Data Science: Whole book about R programming. R for Data Science
R-bloggers & Python Forums: Tutorials and advice for R and Python.
Cross Validated: A site for statistics and data analysis queries. Cross Validated
My office hours: If you come to my office hours, I assume you have done the above already, and if you havent I will redirect you through this pipeline. Bring specific questions only! If you want to discuss non 503 related stats, I am definitely open to that as well. You guys get first dibs at my office hours (times posted on homepage).
Do not use AI at this point in your education- I know its tempting, but you’re only hurting yourself, and I can usually tell when a response is AI generated, and AI can give some silly responses to some of these more advanced questions. I use AI all the time to speed up my process, but I dont use it to learn, generate ideas, be creative, or to interpret my data; when I use AI to help code, 95% of the time I have to fix something in AI-generated code because there is something wrong. You will be a stronger user of AI tools once you have a grasp of the fundamentals. More on this later!
Note: Avoid using AI at this stage of your education. It can give misleading answers to advanced questions, and you’ll be a stronger AI user once you grasp the fundamentals.
This digital lab manual serves as your primary resource for MES 503. Its structure and features are designed to facilitate your learning and research process throughout the course.
A key feature of this manual is its integration with R, which will become evident starting week 3. For example:
# Sample R code
data <- c(1, 2, 3, 4, 5)
mean_value <- mean(data)
print(paste("The mean is:", mean_value))[1] "The mean is: 3"This integration allows you to see the immediate outcome of code, and see the explanation for that code in context.
In fact, this manual is built using R Markdown and Quarto, demonstrating R’s capability beyond data analysis.