Activity #1
The primary goal of this activity is to emphasize the importance of effectively organizing and formatting data for research purposes. You’ll be introduced to the foundational aspects of Microsoft Excel, focusing on data entry, basic Excel shortcuts, and formula applications.
Data Entry Demo
The dataset, “demo_dataEntry_cleared.xlsx,” comprises 2 sheets: one for data, one for metadata. This data was collected at Black Point on December 7 2017 by L. Olinger. We will finish entering the data and metadata. (the answer is in the third sheet “data-filled”). We will go over this, and then you will have a chance to practice on your own using the below…
Your turn
This activity aims to emphasize the importance of effectively organizing and formatting data for research purposes. You’ll be introduced to the foundational aspects of Microsoft Excel, focusing on data entry, basic Excel shortcuts, and formula applications.
Dataset
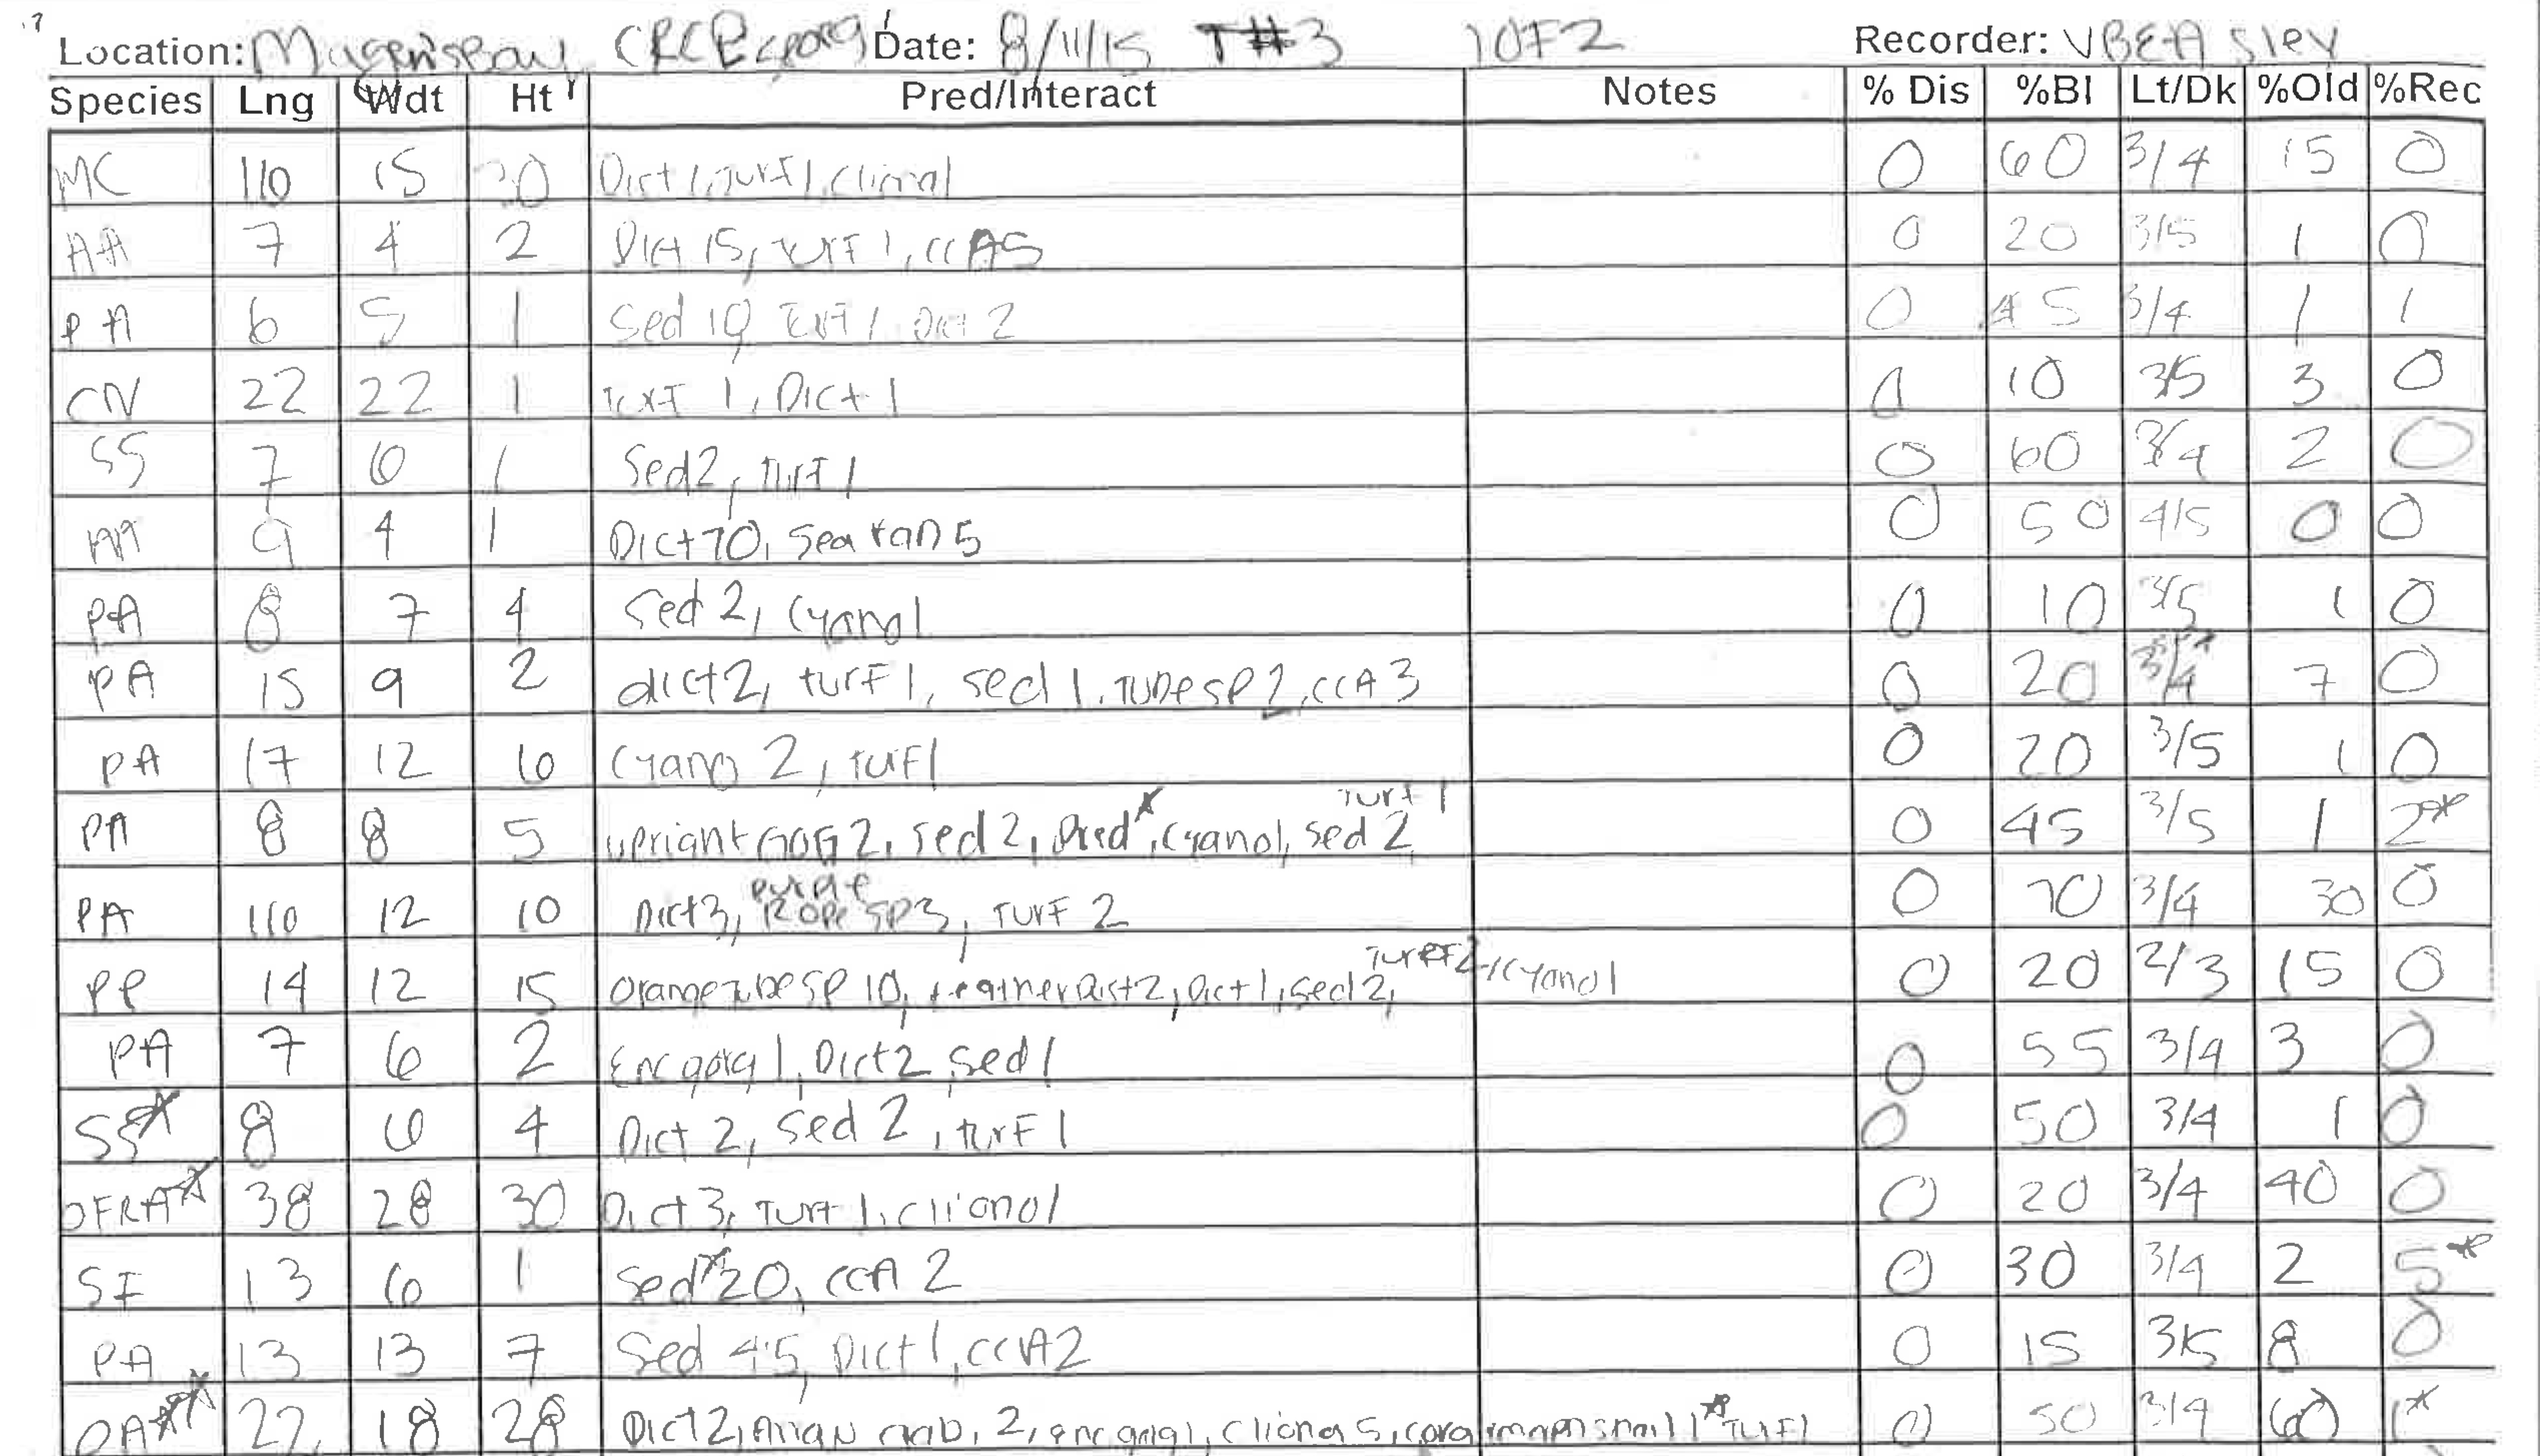
We’ll be using the below image and informtion to make an entirely new excel workbook, to simulate your first real data entry. The data you are inputting includes information about coral Species using TCRMP codes, colony length (cm), colony width (cm), colony height (cm), and percentage of colonies that are Diseased, Bleached, and with Old Mortality, and and Recent Mortality.
Steps
1. Creating a Data Sheet in Excel
Imagine you’ve just returned from the field with a data sheet. Your primary task is to replicate this data sheet in Excel.
- Open Excel and create a new blank workbook.
- Save it with a memorable name in a subfolder for your MES503 lab (e.g.,
Lab1DataEntry.xlsx).
TIP: It’s good practice to save frequently, especially in WAPA territory. You can set up Excel to auto-save every few minutes in File > Options > Save.
2. Setting up the Data Sheet
Rename your current sheet “data” (click on the sheet tab at the bottom of the window until you can edit text).
Add the following columns:
- Index (this will be filled with 1, 2, 3, 4, 5, 6, … number of rows to the left of the data to keep track of each colony)
- Location
- Date
- Recorder
- Transect
- Species
- Lng
- Wdt
- Ht
- %dis
- %bl
- %old
- %rec
TIP: When setting up your columns, consider the order that makes the most sense for your data analysis. Generally, it’s good to have identifying information (like Index, Location, Date) first, followed by your measurement data.
- Enter all data for the above columns in tabular format.
TIP: Good handwriting is crucial when collecting data in the field. If you can’t read your own writing later, the data becomes useless!
3. Data Entry Shortcuts
For data entry of columns like Location, Date, Recorder, and Transect, you might find yourself typing the same thing repeatedly. Excel offers shortcuts to avoid repetitive manual entry:
Copy and Paste: A standard method, but might be time-consuming for large datasets.
Drag Fill:
- Type your data in the first cell.
- Hover over the bottom-right corner of the cell until you see a small square (or a ‘+’).
- Drag this square down to fill the subsequent cells with the same data.
- You can also double-click the bottom right corner to fill down.
TIP: Drag fill is particularly useful for creating series (like dates or numbers) as well as copying repeated values.
- Keyboard Shortcut:
- After typing the data in the first cell, navigate to the last cell you want to fill.
- Hold ‘Ctrl’ and ‘Shift’ and then press the up arrow. This selects all cells between the first and last.
- Now, press ‘Ctrl’ + ‘D’ to fill them with the initial value.
- For designating unique numbers to colonies (aka indices):
- You can manually type in incremental numbers (1, 2, 3,…)
- Or use Excel’s auto-fill feature: In the first two rows, type 1 and 2. Select both cells. Use the drag-fill method described above to generate a number series down the column.
TIP: For more Excel basics and helpful tips, check out excelfrog
4. Generate Metadata
Create a new sheet in the same workbook and name it “metadata”.
Define each column in the data worksheet. IMPORTANT : all the information you need to fill out this metadata is included on this page. Did you read through it fully?
Include a short description of the data you collected. In this instance, you are entering data from a 2015 coral health survey, using TCRMP protocols, and it looks like it was conducted during a bleaching event.
TIP: Good metadata is crucial for the long-term usability of your data. Someone (including future you!) should be able to understand your data fully just by reading your metadata.
5. Basic Data Analysis
Once your data is in place, conduct preliminary analyses using Excel’s built-in functions:
- Average: Use the formula
=AVERAGE(range)whererangeis the group of cells you want the average of. - Standard Deviation:
=STDEV(range) - Variance:
=VAR(range) - Standard Error:
=STDEV(range)/SQRT(COUNT(range))
TIP: Note the structure of these Excel formulae. These are going to be similar syntax to the code you will eventually be writing in R. The terms before the parentheses are called “functions” and the terms inside the parentheses are called “arguments”.
TIP: When using functions, you can click and drag to select the range, or type it manually. For example,
=AVERAGE(B2:B10)calculates the average of cells B2 through B10.
6. Saving and Reviewing
- Save your work frequently.
- Before considering the task complete, review your data entry for any obvious errors or inconsistencies.
TIP: It’s often helpful to sort your data in different ways to spot potential errors. For example, sorting by date might reveal an entry that’s out of chronological order.