Analyzing Categorical Data Patterns
Pattern Recognition Through Frequency

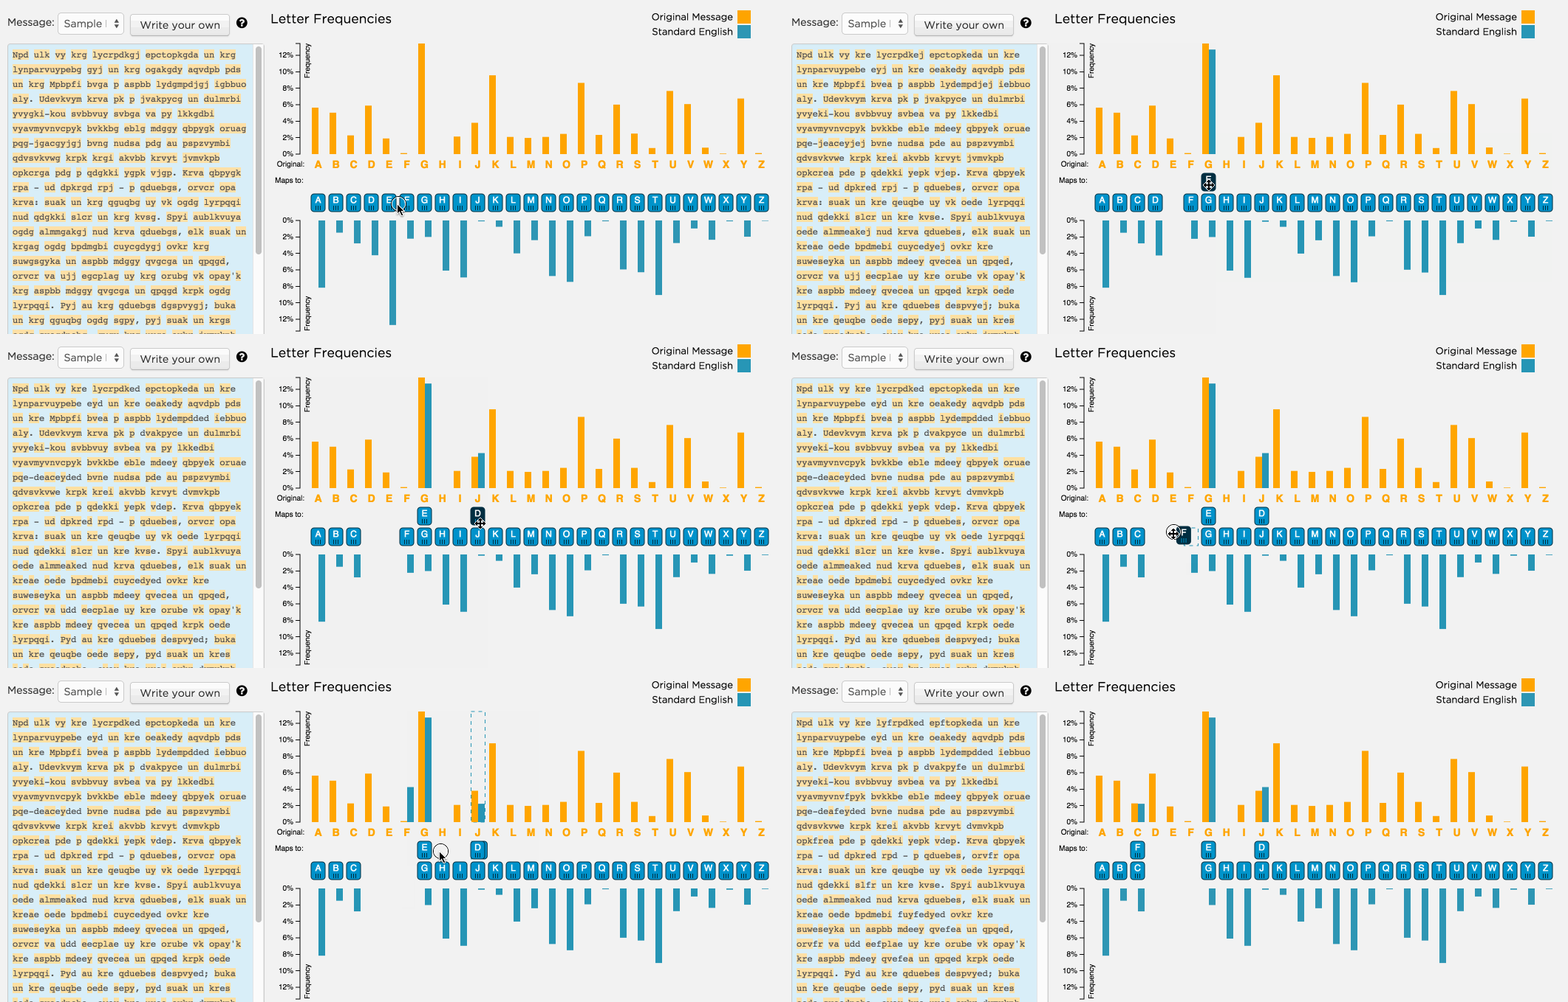
play with the cryptography/ frequency analysis widget here
Statistical analysis often begins with understanding how often things occur in our data. When working with categorical data, we use two complementary approaches: frequency analysis and contingency analysis.
Understanding the Two Approaches
Frequency analysis counts occurrences within a single variable. Think of it as taking inventory - how many times does each category appear in your dataset? For instance, counting the number of students who prefer different music genres gives you a frequency distribution. This distribution reveals patterns that might not be obvious in raw data, helping identify common categories or unusual patterns.
Contingency analysis explores relationships between multiple categorical variables. Instead of just counting one variable, we examine how different variables interact. For example, we might look at how music preferences vary across different age groups or geographic regions. This approach creates contingency tables (also called cross-tabulations) that show these relationships clearly.
Remember: Frequency analysis examines one variable at a time, while contingency analysis reveals relationships between variables.
