Correlation vs. Linear Regression
Distinguishing Between Correlation and Regression
While both correlation and linear regression are statistical methods used to examine relationships between variables, they serve distinct purposes and yield different interpretations. Understanding these differences is crucial for selecting the appropriate analysis method for your data.
To illustrate these concepts, let’s create a dataset examining the relationship between depth and organism abundance in an ecosystem:
Correlation Analysis
As we just learned, Correlation quantifies the strength and direction of the linear relationship between two variables. It treats both variables equally, without distinguishing between dependent and independent variables.
Let’s calculate the correlation:
correlation_result <- cor.test(ecosystem_data$Depth, ecosystem_data$Organism_Abundance, method="pearson")
correlation_result
    Pearson's product-moment correlation

data:  ecosystem_data$Depth and ecosystem_data$Organism_Abundance
t = -10.758, df = 98, p-value < 2.2e-16
alternative hypothesis: true correlation is not equal to 0
95 percent confidence interval:
 -0.8145395 -0.6305714
sample estimates:
       cor
-0.7358503
The Pearson correlation coefficient of approximately -0.74 indicates a strong negative linear relationship between Depth and Organism_Abundance. This suggests that as depth increases, organism abundance tends to decrease. The 95% confidence interval provides a range where we’re 95% confident the true population correlation lies.
Linear Regression
Linear regression, on the other hand, predicts the value of a dependent variable based on one or more independent variables. It distinguishes between dependent and independent variables and provides a regression equation describing their relationship.
Let’s perform a linear regression on our data:
Call:
lm(formula = Organism_Abundance ~ Depth, data = ecosystem_data)

Residuals:
    Min      1Q  Median      3Q     Max
-605.11 -102.72    9.15  115.74  518.97

Coefficients:
            Estimate Std. Error t value Pr(>|t|)
(Intercept) 949.2386    37.2429   25.49   <2e-16 ***
Depth        -1.3257     0.1232  -10.76   <2e-16 ***
---
Signif. codes:  0 '***' 0.001 '**' 0.01 '*' 0.05 '.' 0.1 ' ' 1

Residual standard error: 185.1 on 98 degrees of freedom
Multiple R-squared:  0.5415,    Adjusted R-squared:  0.5368
F-statistic: 115.7 on 1 and 98 DF,  p-value: < 2.2e-16
This linear regression model reveals that for every one-meter increase in Depth, the Organism_Abundance decreases by approximately 1.33 units. The model is statistically significant (p-value < 2e-16) and explains about 54.15% of the variability in Organism_Abundance (as indicated by the R-squared value).
Key Differences
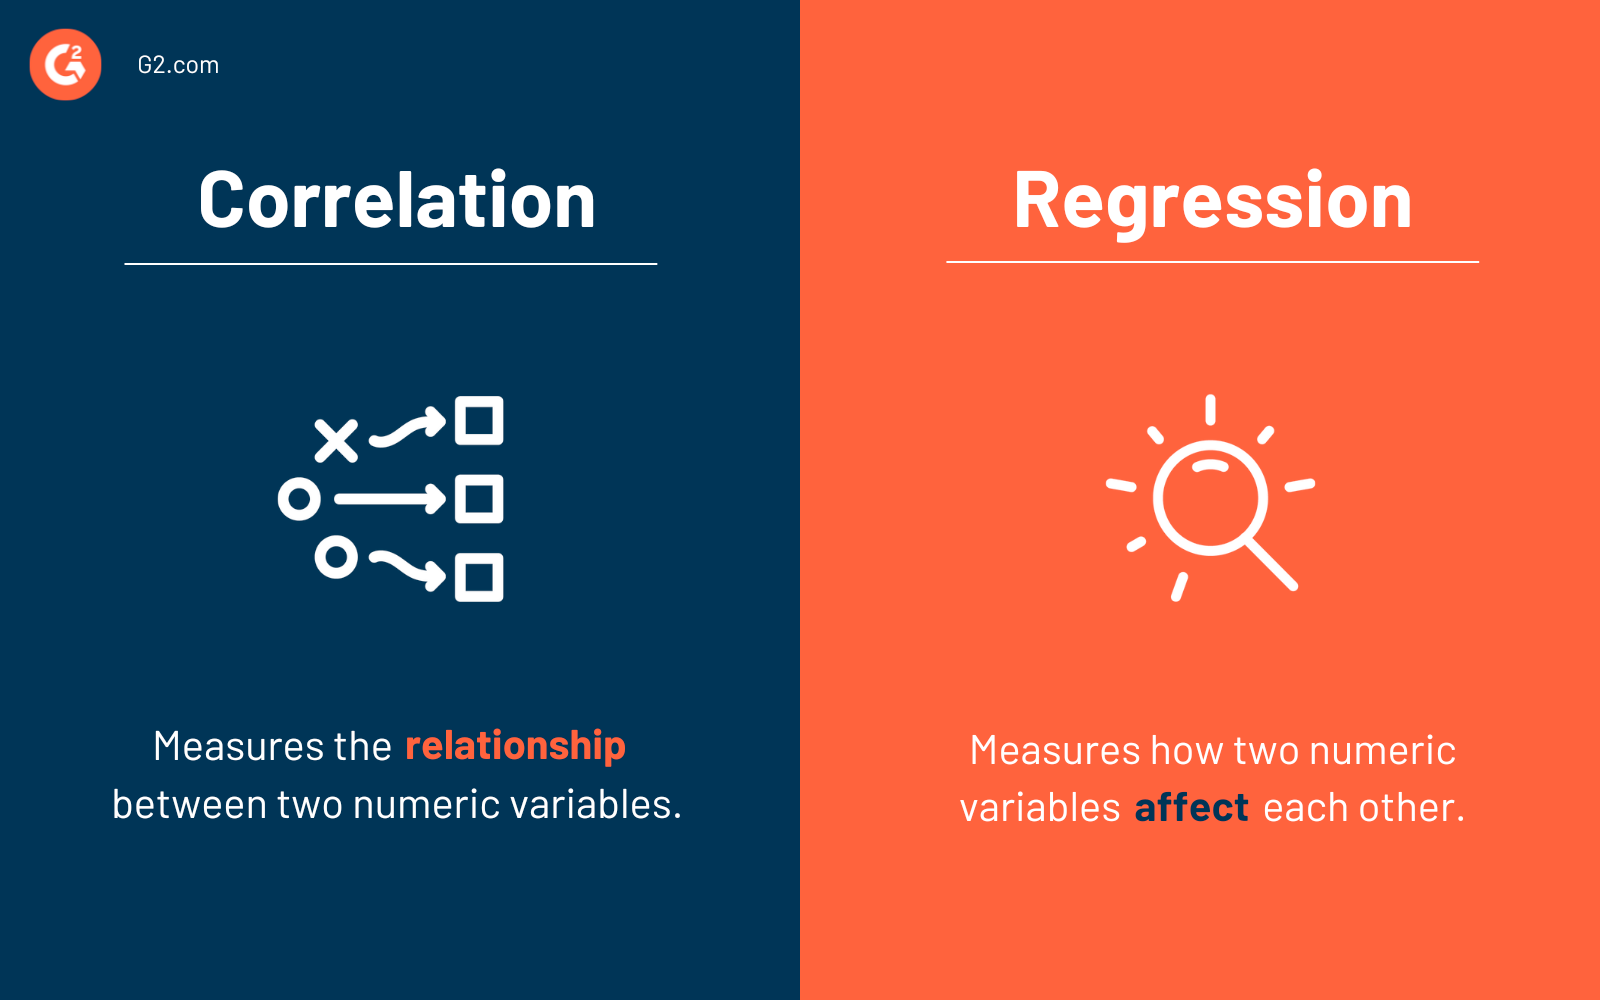
Purpose: Correlation quantifies the strength and direction of a relationship, while regression provides a predictive equation.
Variable Roles: Correlation treats variables equally, while regression distinguishes between dependent and independent variables.
Output: Correlation gives a coefficient between -1 and 1, while regression provides coefficients for the intercept and slope of the predictive equation.
Prediction: Regression allows for prediction of the dependent variable, while correlation does not.
Causality: Neither correlation nor regression prove causality, but regression implies a directional relationship that correlation does not.
Understanding these differences is crucial for choosing the appropriate analysis method based on your research questions and data characteristics. Both correlation and regression are valuable tools in a statistician’s toolkit, each serving specific purposes in data analysis and interpretation.
Summary:
While correlation simply quantifies the strength and direction of a linear relationship between two variables, linear regression provides a tool to predict the value of one variable based on another. The choice between them depends on the research question and the nature of the data.
Learn More
For further reading, see here