Statistical/Hypothesis Testing
What follows is a very brief overview and some definitions that may be useful for your lab activities, but please refer to the course content taught by Kayla and the further reading below for a more in depth overview!
Statistical Hypotheses
Statistical hypotheses: Formal statements used in hypothesis testing about the presence or absence of an effect, difference, or relationship in a population and consisting of the Null Hypothesis (H₀) and the Alternative Hypothesis (H₁).
Null Hypothesis (H₀): A statement of no effect, no difference, or no relationship.
Alternative Hypothesis (H₁): A statement suggesting an effect, difference, or relationship exists.
In scientific research, formulating clear and testable hypotheses is crucial for conducting rigorous investigations. The null hypothesis (H₀) and alternative hypothesis (H₁) form the foundation of statistical inference.
The null hypothesis typically represents a statement of no effect or no difference. It’s the default position that researchers aim to test against. Null hypotheses often address the absence of relationships between environmental factors and organisms, or the lack of human impact on ecosystems.
For example, a study examining the effects of ocean acidification on shellfish growth might propose the following null hypothesis:
H₀: Changes in water pH have no effect on the growth rate of bivalve mollusks.
The alternative hypothesis, conversely, suggests that there is an effect or difference. It represents the researcher’s expectation based on prior knowledge or theoretical predictions. For the ocean acidification study, the alternative hypothesis could be:
H₁: Changes in water pH affect the growth rate of bivalve mollusks.
Researchers may also employ directional (one-tailed) alternative hypotheses when they have a specific prediction about the nature of the effect. For instance, in a study on the impact of protected areas on fish populations:
H₀: Fish biomass within protected areas is equal to or less than in unprotected areas.
H₁: Fish biomass is greater within protected areas than in unprotected areas.
This directional hypothesis reflects the expectation that protected areas have a positive effect on fish biomass.
The formulation of these hypotheses guides the entire research process, from study design to data analysis and interpretation.
Scientific Hypotheses
Scientific Hypothesis : a proposed explanation for a phenomenon based on prior knowledge or observation.
A Scientific Hypothesis is a proposed explanation for a phenomenon based on prior knowledge or observation. It’s a statement about what the researcher expects to find, often expressed in plain language. This is the overarching idea that drives the research.
Scientific hypotheses are distinct from statistical hypotheses, or the formal statements used in hypothesis testing consisting of the Null Hypothesis (H₀) (statement of no effect or no difference; what we test against statistically) and the Alternative Hypothesis (H₁) (statement suggesting an effect or difference).
Key Differences: - The scientific hypothesis is conceptual, while statistical hypotheses are mathematical. - Statistical hypotheses are always paired (null and alternative), while a scientific hypothesis stands alone. - The scientific hypothesis often translates into the alternative hypothesis in statistical testing.
Example: Scientific Hypothesis: “Increased ocean temperature leads to coral bleaching.” Null Hypothesis (H₀): There is no relationship between ocean temperature and coral bleaching. Alternative Hypothesis (H₁): There is a relationship between ocean temperature and coral bleaching.
Significance level and p-values
Significance Level (α): The predetermined threshold for rejecting the null hypothesis.
p-value: The probability of obtaining results at least as extreme as the observed results, assuming the null hypothesis is true.
The significance level, denoted by α (alpha), is set before conducting the study. It represents the probability of rejecting the null hypothesis when it is actually true (Type I error). Common choices for α are 0.05 and 0.01, meaning a 5% or 1% chance of making a Type I error, respectively.
You will likely only ever use α of 0.05.
For example, in a study examining the impact of a pollutant on fish populations, researchers set α = 0.05, meaning they are willing to accept a 5% chance of concluding the pollutant has an effect when it actually doesn’t.
The p-value, on the other hand, is calculated from the data after the study is conducted. It quantifies the strength of evidence against the null hypothesis. A smaller p-value indicates stronger evidence against the null hypothesis.
In our fish population study, if the calculated p-value is 0.03, it means that if the null hypothesis were true (i.e., the pollutant has no effect), we would observe results as extreme as ours, or more extreme, only 3% of the time.
The decision rule in hypothesis testing is to reject the null hypothesis if the p-value is less than the significance level. In our example:
If p-value (0.03) < α (0.05), we reject the null hypothesis.
We conclude there is sufficient evidence to suggest the pollutant affects fish populations.
the p-value does not measure the size or importance of an effect. A very small p-value doesn’t necessarily imply a large or biologically significant effect. Researchers should always consider the practical significance of their results in addition to statistical significance.
Type I and Type II Errors
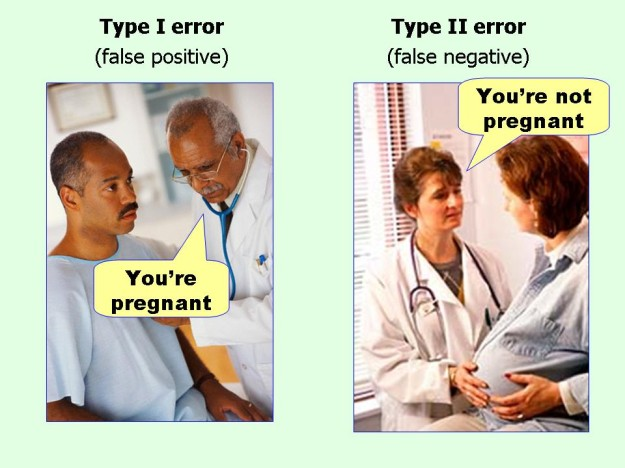
Type I Error: Rejecting the null hypothesis when it is actually true (false positive).
Type II Error: Failing to reject the null hypothesis when it is actually false (false negative).
In hypothesis testing, Type I and Type II errors are crucial concepts that help researchers understand the potential mistakes in their conclusions. A Type I error occurs when we reject a true null hypothesis. The probability of committing a Type I error is equal to the significance level (α). For example, if a researcher sets α = 0.05 and rejects the null hypothesis, there’s a 5% chance that this rejection is incorrect.
In a study examining whether a certain type of algae affects coral growth:
H₀: The algae has no effect on coral growth
H₁: The algae affects coral growth
A Type I error would occur if the researcher concludes the algae affects coral growth when, in reality, it doesn’t.
A Type II error, conversely, happens when we fail to reject a false null hypothesis. The probability of a Type II error is denoted by β (beta). The power of a test, which is 1 - β, represents the probability of correctly rejecting a false null hypothesis.
In our coral study, a Type II error would occur if the researcher concludes the algae has no effect on coral growth when, in fact, it does.
These errors are inversely related. As we decrease the chance of one type of error, we increase the chance of the other. Researchers must balance these risks based on the context of their study:
In conservation studies, where failing to detect a real effect could have serious consequences, researchers might accept a higher risk of Type I errors to reduce Type II errors.
In preliminary screening of potential environmental hazards, researchers might be more concerned with avoiding Type II errors to ensure no potential threats are overlooked.
Understanding these errors helps researchers 1. design more robust studies, 2. Interpret results more accurately, and 3. Make informed decisions about acceptable levels of uncertainty.
General Steps in Hypothesis Testing
State the Hypotheses: Clearly define your null (H₀) and alternative (H₁) hypotheses. This step is crucial as it sets the foundation for your entire analysis. For example:
- H₀: Juvenile shark survivorship is not affected by water temperatures.
- H₁: Juvenile shark survivorship decreases with increasing water temperatures.
Choose the Significance Level (α): Set the threshold for rejecting the null hypothesis, often at 0.05. This means you’re willing to accept a 5% chance of rejecting a true null hypothesis. The choice of α should be based on the consequences of Type I errors in your specific research context.
Select the Appropriate Test and Compute the Test Statistic: Choose a statistical test based on your data type, sample size, and research question. Common tests include:
- t-test for comparing means
- ANOVA for comparing multiple groups
- Chi-square test for categorical data Calculate the test statistic using the formula specific to your chosen test.
Determine the P-value: Calculate the p-value based on your test statistic and the assumed distribution under the null hypothesis. The p-value represents the probability of obtaining results at least as extreme as the observed ones, assuming the null hypothesis is true.
Make a Decision: Compare the p-value to your chosen significance level (α):
- If p-value < α, reject the null hypothesis in favor of the alternative hypothesis.
- If p-value ≥ α, fail to reject the null hypothesis.
For example, if your p-value is 0.03 and α is 0.05, you would reject the null hypothesis.
It’s important to note that these steps provide a framework for basic hypothesis testing. In practice, researchers should also consider factors such as effect size, confidence intervals, and the practical significance of their results. Additionally, more complex research questions may require advanced statistical techniques beyond this basic framework.
Further Reading
Consider a deeper dive into some of these topics with content from “Learning statistics with R” by Danielle Navarro (bookdown translation by Emile Kothe; 2019):
Research hypotheses and statistical hypotheses. Null and alternative hypotheses. ( link).
Type 1 and Type 2 errors (link)
Test statistics and sampling distributions (link)
Hypothesis testing as a decision making process (link)
p-values as “soft” decisions (link)
Writing up the results of a hypothesis test (link)
Effect size and power (link)
A few issues to consider regarding hypothesis testing (link)