###########################
# Lab Activity Week 4: Comparing shark lengths between Atlantic and Pacific Oceans
# Author: Lauren Olinger
# Date: September 11, 2024
###########################Activity 2: Shark lengths comparisons tutorial (all code provided)

Background: You are studying Great White Sharks (Carcharodon carcharias) in two different oceans - the Atlantic and the Pacific. You’ve measured the length of 50 sharks in each ocean, and now you’re interested in determining if there’s a significant difference in the average lengths of sharks between the two oceans.
Dataset: The dataset you have is in wide format, where each row is a shark and columns represent shark lengths (in meters) for each ocean.
Objective: Melt the dataset into long format, visualize the data, perform a t-test to determine if there’s a significant difference in shark lengths between the two oceans, and interpret the results.
Initial Setup
- i. Open a new script and make a header: At the top of your R script, include a header with your name, the date, and a brief description of the analysis.
- ii. Setting the Working Directory: Set the working directory to where your dataset is located, and where you want to save your scripts and outputs. It is helpful to save these scripts all together so you can come back to them.
setwd("set/your/working/directory/here")-
iii. Loading Packages: Load the necessary packages (e.g.,
dplyr, ggplot2) for the exercise. Make sure you have these installed (install.packages())
1. Load the data (here we are making fake data)
#some fake data
shark_data_wide <- data.frame(
  rep = c(1:50),
  Atlantic = (rnorm(50)+3)/1.5,
  Pacific = rnorm(50)+4
)
the first 6 rows of shark_data_wide:
| rep | Atlantic | Pacific |
|---|---|---|
| 1 | 2.585335 | 4.390119 |
| 2 | 1.129126 | 5.374139 |
| 3 | 2.194021 | 3.670051 |
| 4 | 1.345034 | 3.861170 |
| 5 | 2.041094 | 3.854968 |
| 6 | 2.345381 | 2.721787 |
Notice that the variables we want to compare (the shark lengths from Atlantic and Pacific oceans) are in different columns
2. Melt (using pivot_longer()) the data into long format
shark_data_long <- shark_data_wide |>
  pivot_longer(cols = c(Atlantic, Pacific),
               names_to = "ocean",
               values_to = "length_m")

glimpse(shark_data_long)
Rows: 100
Columns: 3
$ rep <int> 1, 1, 2, 2, 3, 3, 4, 4, 5, 5, 6, 6, 7, 7, 8, 8, 9, 9, 10, 10,…
$ ocean <chr> "Atlantic", "Pacific", "Atlantic", "Pacific", "Atlantic", "Pa…
$ length_m <dbl> 2.5853354, 4.3901195, 1.1291260, 5.3741387, 2.1940215, 3.6700…Here is how the first 6 rows of shark_data_long looks after pivot_longer() :
| rep | ocean | length_m |
|---|---|---|
| 1 | Atlantic | 2.585335 |
| 1 | Pacific | 4.390119 |
| 2 | Atlantic | 1.129126 |
| 2 | Pacific | 5.374139 |
| 3 | Atlantic | 2.194021 |
| 3 | Pacific | 3.670051 |
3. Summarise your data: calculate mean and standard error of the mean (SEM) growth of each group
| ocean | meanlength_m | semlength_m |
|---|---|---|
| Atlantic | 1.955046 | 0.0950083 |
| Pacific | 3.970454 | 0.1466515 |
4. Visualize the data
Plotting can provide a visual summary of the data. We’ll use ggplot2. Here we are making a histogram of the data.
- Do these data look normally distributed?
# Change the width of bins & color by group
ggplot(shark_data_long,
       aes(x = length_m,
           group = ocean,
           fill = ocean),
       alpha = 0.5) +
  geom_histogram(binwidth = 0.5,
                 position = "identity",
                 alpha=0.5) +
  theme_minimal()  +
  xlab("length (m)") +
  ylab("frequency") +
  ggtitle("Distribution of lengths of great white sharks in Atlantic and Pacific Ocean")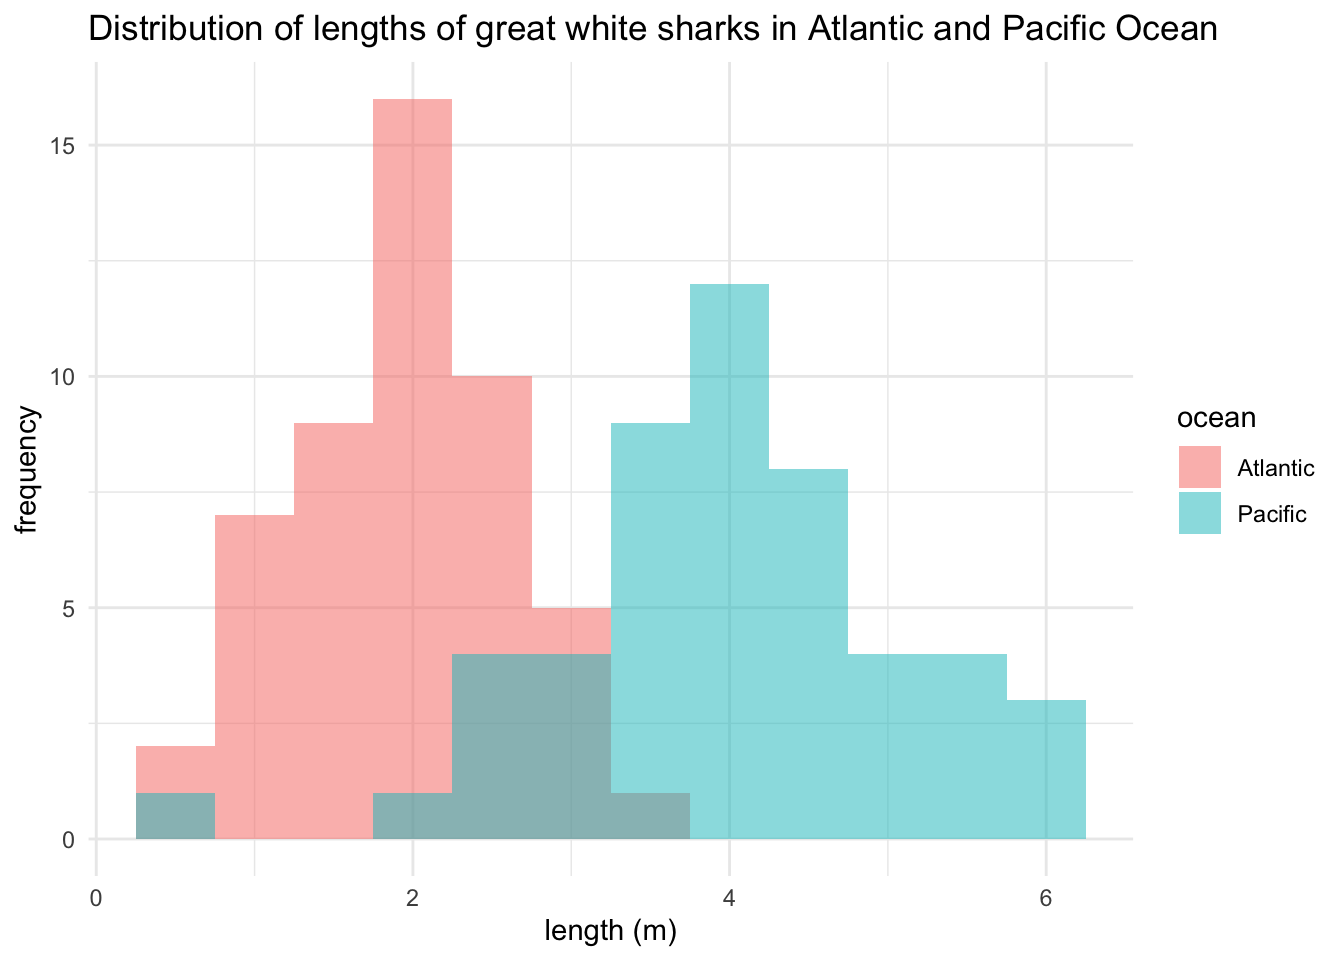
5. Perform a t-test
To test if there’s a significant difference in the lengths of sharks from the two oceans, we’ll use an independent two-sample t-test.
    Two Sample t-test

data:  length_m by ocean
t = -11.534, df = 98, p-value < 2.2e-16
alternative hypothesis: true difference in means between group Atlantic and group Pacific is not equal to 0
95 percent confidence interval:
 -2.362169 -1.668646
sample estimates:
mean in group Atlantic  mean in group Pacific
              1.955047               3.970454
6. Interpret the Results
What are your null and alternative hypotheses? Do you reject the null hypothesis? At what significance level? Report the means ± SEM of lengths in each ocean. Draw conclusions about the significance of the difference in shark lengths between the two oceans. Consider the assumptions of the t-test and evaluate whether they hold for this dataset.